
9 AP KPIs for Data-Driven Decisions
Want to improve your accounts payable (AP) process? Start with these 9 KPIs. They measure outcomes, not just activity, helping you cut costs, speed up payments, and reduce errors. Here’s a quick breakdown:
- Days Payable Outstanding (DPO): Tracks how long you take to pay suppliers.
- Cost Per Invoice: Measures how much it costs to process one invoice.
- Invoice Cycle Time: Monitors how quickly invoices move from receipt to payment.
- First Pass Match Rate: Shows the percentage of invoices processed without manual fixes.
- Invoice Exception Rate: Highlights the percentage of invoices needing manual intervention.
- Electronic Payment Adoption Rate: Tracks how many payments are made digitally.
- Early Payment Discount Capture Rate: Measures how often you take advantage of discounts for early payments.
- Supplier On-Time Payment Rate: Tracks how often you pay invoices by their due date.
- AP Staff Productivity: Shows how many invoices your team processes per employee.
These metrics help you identify inefficiencies, improve cash flow, and strengthen supplier relationships. Tools like Oracle ERP and AP Express can simplify tracking and automation, driving better results for your AP team.
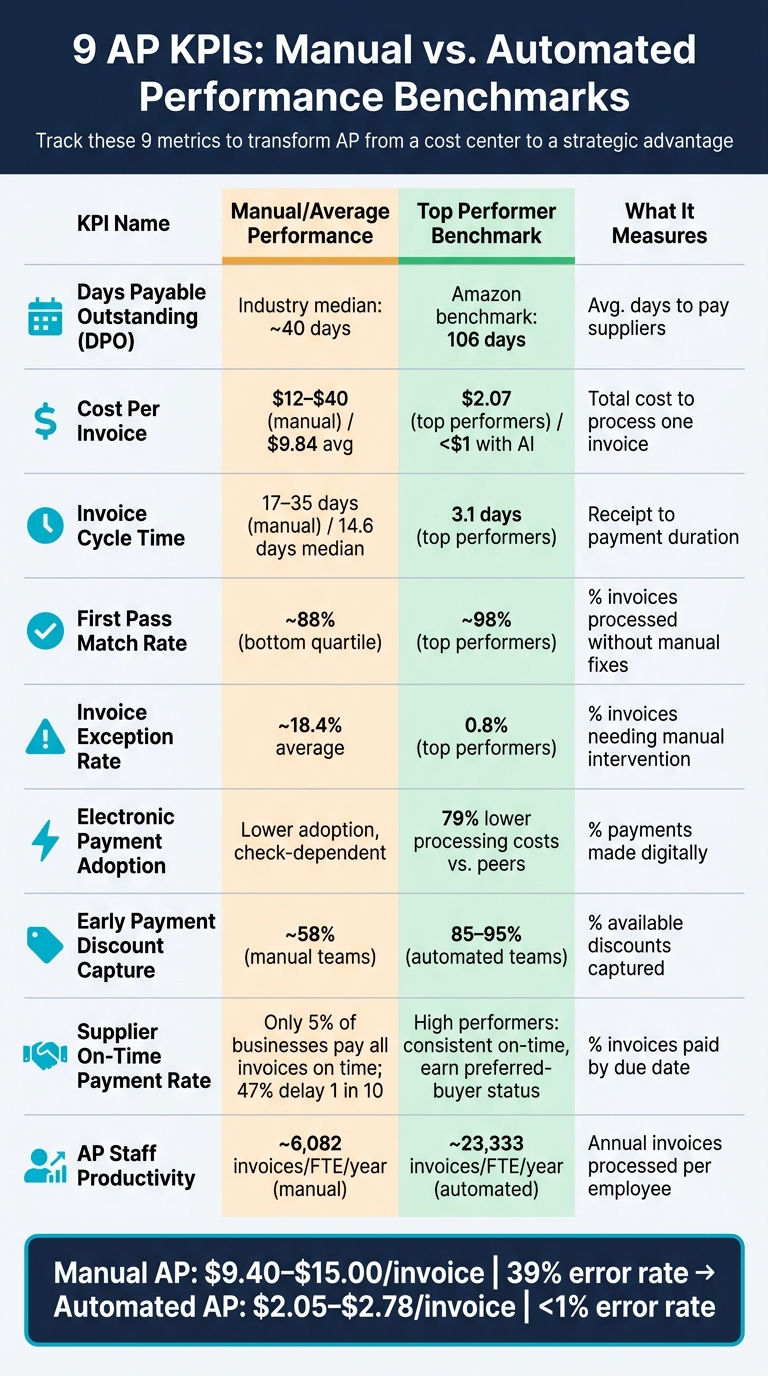
1. Days Payable Outstanding (DPO)
Days Payable Outstanding (DPO) tracks how many days, on average, it takes for a company to pay its suppliers after receiving an invoice. This metric is a key indicator of how well your Accounts Payable (AP) team handles cash flow and payment timing.
Here’s the formula:
(Accounts Payable ÷ Cost of Goods Sold) × Number of Days in the Period
To ensure accuracy, use the average of beginning and ending AP balances to account for any seasonal fluctuations. Across industries, the median DPO hovers around 40 days, though this can vary widely depending on the sector:
| Industry | Typical DPO Range |
|---|---|
| Manufacturing | 60–90 days |
| Technology | 45–60 days |
| Retail | 30–45 days |
| Professional Services | 20–35 days |
A higher DPO indicates that a company holds onto its cash longer, freeing up funds for other operational needs. For example, Amazon reported a DPO of approximately 106 days for fiscal year 2024. This was calculated using an average AP balance of $94.4 billion and a Cost of Goods Sold (COGS) of $326.3 billion, showcasing the company’s ability to negotiate favorable payment terms with suppliers. On the other hand, a very low DPO might signal that a company is paying invoices too quickly, potentially straining its cash reserves unnecessarily.
“A high DPO can sabotage strategic supplier or vendor relationships, and a too-low DPO constrains liquidity.” – Perry D. Wiggins, CFO, APQC
Another aspect to consider is the “Terms Gap”, which refers to the difference between the invoice due date and the actual payment date. This gap typically falls between 5 and 15 days, as companies often process payments in batches. Addressing this gap doesn’t require renegotiating contracts but instead improving payment timing. Tools like AP Express can simplify this process by integrating with systems like Oracle EBS, ERP Cloud, and JD Edwards. This gives AP teams real-time insights into outstanding obligations, enabling precise scheduling to ensure payments are made exactly when due.
Next, let’s dive into another key metric that shapes AP efficiency: Cost Per Invoice.
2. Cost Per Invoice
The cost per invoice measures the total expense involved in processing a supplier invoice from start to finish – receipt through payment. The formula is simple:
Total AP Processing Costs ÷ Total Number of Invoices Processed
This calculation considers everything: staff salaries, software subscriptions, payment fees, and general operational overhead.
For manual invoice processing, the cost ranges between $12 and $40 per invoice. Labor alone makes up about 62% of this total. However, top-performing accounts payable (AP) departments have managed to slash this cost to around $2.07 per invoice, compared to the industry average of $9.84. With AI-powered automation like AP Express, these expenses can drop even further – sometimes to under $1 per invoice.
“Cost per invoice is one of the most revealing AP metrics… it reflects every touch, delay, and rework cycle across the entire process.”
Breaking down the costs, data capture and entry contribute 30–35%, while exception handling adds another 20–25%. On top of that, about 39% of manually processed invoices contain at least one data entry error, with each mistake costing an average of $52 to investigate and fix.
For teams using Oracle EBS, ERP Cloud, or JD Edwards, automation offers a clear path to savings. Tools like AP Express use AI-powered invoice digitization to eliminate manual data entry and streamline matching workflows within Oracle systems. This leads to fewer touches per invoice, reduced errors, and a scalable cost structure that grows with your invoice volume – not your headcount.
Next, we’ll dive into Invoice Cycle Time to uncover even more ways to optimize AP processes.
3. Invoice Cycle Time
Invoice cycle time is a critical metric that highlights processing delays. It tracks the total number of calendar days from when an invoice is received to when payment is sent. This is calculated using the formula: Payment Date − Invoice Receipt Date. Breaking this process into smaller stages – such as receipt to entry, entry to approval, and exception handling – helps pinpoint where delays occur.
Top-performing accounts payable (AP) teams complete the entire cycle in just 3.1 days. In contrast, the industry median sits at about 14.6 days, while organizations relying on manual processes may take anywhere from 17 to 35 days to process a single invoice. These delays not only reduce efficiency but can also harm supplier relationships, result in late fees, and cause missed opportunities for early payment discounts.
Approval routing is the biggest bottleneck, accounting for 35% to 50% of total processing time. On top of that, each exception adds an average of six extra days to the process.
For companies using Oracle EBS, ERP Cloud, or JD Edwards, automation offers a solution to these challenges. Tools like AP Express leverage AI-powered digitization to eliminate manual data entry and streamline invoice routing through customizable workflows. Meanwhile, Oracle’s built-in analytics provide real-time insights into metrics like AP Average Days on Hold, helping finance teams identify and address delays before they escalate.
Faster invoice processing delivers measurable financial benefits. For example, reducing cycle time increases the likelihood of capturing early payment discounts, such as the 2/10 Net 30 terms. These discounts can yield an annualized return of around 36%. By optimizing cycle times, organizations not only cut costs but also position themselves to take full advantage of early payment opportunities.
4. First Pass Match Rate
The first pass match rate shows the percentage of invoices that go from receipt to payment without needing manual fixes or intervention. It’s essentially a quality indicator for your accounts payable (AP) process, highlighting how well procurement, receiving, and AP teams are working together.
The calculation is simple: divide the number of invoices correctly processed on the first try by the total number of invoices processed, then multiply by 100. For example, if your rate is 98%, almost every invoice clears without issues. But at 88%, about 1 in 8 invoices runs into problems – and those problems can quickly add up.
High-performing teams typically achieve a 98% accuracy rate on the first pass, while those in the bottom quartile average around 88%. Every invoice that doesn’t pass on the first attempt becomes an exception, and Andrew Bartolini of Ardent Partners sums it up perfectly:
“Exceptions are typically the biggest single reason why [AP] benchmarks… are not lower. They continue to be the bane of AP’s existence.”
Invoices tied to Purchase Orders (POs) generally perform better because three-way matching automates the validation of routine data points. On the other hand, non-PO invoices often require manual coding and verification, which increases the likelihood of errors. A straightforward way to cut down on these issues is to standardize vendor onboarding – requiring PO numbers and consistent file formats from suppliers can significantly reduce bad data entering the system.
If your team uses Oracle EBS, ERP Cloud, or JD Edwards, tools like AP Express can help. These tools leverage AI-powered invoice digitization to address common issues like misread characters or incorrect decimal points, which are frequent causes of matching failures. Additionally, an Automatch Rate report in the dashboard tracks how many invoices are matched automatically versus those requiring manual intervention, giving AP managers a clear picture of where breakdowns occur.
Next, we’ll look at how the Invoice Exception Rate plays a role in AP efficiency.
5. Invoice Exception Rate
The invoice exception rate measures the percentage of invoices that fail automated validation and require manual intervention before payment processing. For example, if 65% of invoices are processed automatically, the remaining 35% need manual handling.
The formula to calculate this rate is:
(Total invoices flagged for exceptions ÷ Total invoices processed) × 100.
On average, accounts payable (AP) teams flag about 18.4% of invoices as exceptions, but top-performing teams manage to bring this down to as low as 0.8%. To put this into perspective, if it takes 12 minutes to resolve an exception and the labor cost is $45 per hour, each exception costs about $9. For an organization processing 1,000 invoices monthly with a 35% exception rate, the annual cost exceeds $37,000.
The causes of exceptions are varied. Around 25–35% stem from purchase order (PO) matching failures, while vendor data mismatches and general ledger (GL) coding errors each contribute another 20–30%. Other issues often arise from missing or invalid data and compliance discrepancies. Addressing these challenges starts with identifying the root causes. For instance, implementing a “No PO, No Pay” policy – requiring invoices to include PO numbers – can significantly reduce matching failures.
For organizations using Oracle EBS, ERP Cloud, or JD Edwards, exceptions can be tracked through prebuilt metrics like “AP Invoices on Hold”, “AP Total Holds Count”, and “AP Average Days on Hold”. These dashboards not only show the number of invoices stuck in the process but also highlight the dollar value tied up in exceptions, offering better visibility into potential cash flow risks. Additionally, tools like AP Express leverage AI to improve invoice digitization, fixing errors such as misread fields, poor scan quality, and duplicate entries that frequently cause exceptions. Reducing the exception rate has a ripple effect: it saves time, shortens invoice processing cycles, reduces late payment fees, and allows staff to focus on more strategic tasks. Notably, AP teams in the bottom quartile spend nearly 26.9% of their time addressing supplier inquiries, much of which stems from unresolved exceptions.
6. Electronic Payment Adoption Rate
The electronic payment adoption rate tracks the percentage of supplier payments made through digital methods – like ACH transfers, wire transfers, or virtual cards – rather than traditional paper checks. This metric highlights how modernized your accounts payable (AP) processes are.
To calculate this rate, you can use one of two methods:
- By volume:
(Number of electronic payments ÷ Total payments issued) × 100 - By spend value:
(Dollar amount of electronic payments ÷ Total payment value).
Switching to digital payments offers major benefits, such as cutting costs and reducing fraud risk. For example, top-performing AP teams report invoice processing costs that are 79% lower than their peers. Fraud is another big concern – 63% of organizations reported check fraud incidents in 2024, compared to just 20% for ACH transfers and 10% for wire transfers. Moving away from checks not only boosts efficiency but also limits exposure to fraud.
The numbers back up this shift: the ACH Network processed 7.35 billion B2B payments, totaling $58.24 trillion in 2024. Despite this, many AP teams still rely on manual payments, largely due to slower supplier enablement processes. Leading organizations, however, enable 1.4 times more suppliers for electronic payments compared to average performers. Tools like Oracle ERP systems make this transition smoother, offering real-time tracking and improved supplier interactions.
For those leveraging Oracle ERP, the Key Indicators Payment Report in Oracle Fusion provides insights into payment method distribution by pulling data from tables like AP_CHECKS_ALL and AP_INVOICE_PAYMENTS_ALL. Additionally, platforms like AP Express simplify the process by combining supplier self-service portals with features like automated payment scheduling and virtual card options. These tools not only speed up payments but also offer a more transparent and efficient experience, encouraging suppliers to move away from paper-based methods.
“The keys to the castle will ultimately be given to the AP teams who can anticipate and adapt to dynamic change within their organizations and within their supply chains.” – Andrew Bartolini, Ardent Partners
7. Early Payment Discount Capture Rate
This metric sheds light on how efficient payment practices can lead to real cost savings. The early payment discount capture rate tracks the percentage of supplier discounts your team secures by paying invoices before the discount deadline. In essence, it quantifies the financial benefit of timely payments.
To calculate it, use this formula: (Discounts captured ÷ Total discounts available) × 100. Want to know if a discount is worth chasing? Use the annualized return formula: (Discount % × (365 ÷ Days accelerated)). For example, with “2/10 net 30” terms – offering 2% off for payments within 10 days – the annualized return is a striking 36.5%. If that return outpaces your cost of capital, prioritizing the discount is a no-brainer. Oracle systems make it easier to act on these insights.
Statistically, manual AP teams manage to capture only about 58% of available discounts. In contrast, automated teams achieve an impressive 85% to 95% capture rate. The main culprit behind missed discounts? Approval delays, which consume over 60% of invoice processing time. Missing a 2% discount on $100,000 in monthly invoices means losing $2,000 every month – or $24,000 annually.
“A lost discount is a guaranteed return you chose not to take.” – AI Analyst, Oracle Fusion Payables Discounts Taken and Lost Report
Oracle Fusion tackles this issue head-on with KPIs like AP Discount Taken % and AP Discount Offered %, as well as the Payables Discounts Taken and Lost Report. These tools identify where discount losses occur across business units. By pulling data from Oracle tables like AP_PAYMENT_SCHEDULES_ALL, the system highlights invoices nearing their discount deadlines. Tools like AP Express streamline approval workflows and leverage smart scheduling to prioritize and secure high-value discounts efficiently.
8. Supplier On-Time Payment Rate
The supplier on-time payment rate tracks the percentage of invoices paid by their due date. In Oracle ERP, this is referred to as “On Time Payment Performance”, and it can be measured by transaction count or payment value. The formula is simple: (On-time payments ÷ Total payments) × 100. Like other efficiency-focused KPIs, this metric highlights the importance of paying suppliers promptly.
A high on-time payment rate reflects efficient processes, such as streamlined approval workflows and accurate invoice data. On the other hand, a low rate often points to internal delays that prevent timely payments. Paying invoices on time not only avoids penalties but also strengthens supplier relationships, which is key to maintaining an efficient accounts payable (AP) operation.
Statistics reveal that only 5% of businesses manage to pay all invoices on time, while 47% delay at least one in ten payments. Late payments can lead suppliers to adjust terms or raise costs to account for unpredictability. Conversely, consistent on-time payments can earn preferred-buyer status, which comes with perks like better pricing, priority during supply shortages, and long-term contract advantages. It’s worth noting that 40% of AP teams cite strained vendor relationships as a major concern linked to payment delays.
Oracle ERP offers tools to keep payments on track, such as real-time alerts for due invoices. The Payables Command Center highlights invoices due within the next seven days and flags those on hold to prevent overdue payments. Additionally, metrics like “AP Average Days Overdue” and “AP % Interest Penalties Paid” help quantify the financial impact of late payments, which can support efforts to improve processes. These insights are sourced from key tables like AP_CHECKS_ALL and AP_INVOICE_PAYMENTS_ALL, ensuring accurate and up-to-date reporting.
To further improve punctuality, tools like AP Express automate approval workflows and payment scheduling across Oracle EBS, ERP Cloud, and JD Edwards systems. This eliminates common manual delays. The Holds Dashboard helps resolve payment holds proactively, while Payment Priority rankings (scored 1–99) allow businesses to prioritize critical supplier payments. These strategies not only improve payment timeliness but also complement other KPIs aimed at optimizing AP processes.
9. AP Staff Productivity
AP staff productivity measures how much work each employee handles, providing a clear snapshot of team efficiency. To calculate it, divide the total annual invoices by the number of full-time equivalents (FTEs) in the accounts payable (AP) department. This metric works hand-in-hand with other KPIs, highlighting how automation affects individual performance.
Here’s a striking comparison: manual processes typically result in about 6,082 invoices processed per staff member annually. But with automation, this number jumps to 23,333 invoices – almost four times higher.
This metric does more than just measure output; it helps pinpoint areas for improvement. For instance, if invoices per FTE drop while cycle times increase, it signals a capacity issue. On the other hand, if productivity is high but exception rates climb, it could mean staff are rushing through tasks and creating errors. When paired with digital finance transformation strategies, higher AP staff productivity leads to smarter, data-driven decisions.
“Eliminating tedious manual tasks helps elevate accounts payable into a strategic asset to your business, gaining the bandwidth for value-add activities such as analyzing data, identifying trends, and providing actionable insights.” – Monica Neumann, Sr. Manager – Finance Transformation, Auxis
Automation tools, especially those powered by Oracle ERP systems, significantly enhance staff productivity. By reducing the manual processing time for invoices from 12.5 minutes to just 1.2 minutes – a 90% decrease – daily capacity skyrockets from around 35 invoices to as many as 400. Solutions like AP Express take this further by integrating AI-powered invoice digitization and automated workflows across Oracle EBS, ERP Cloud, and JD Edwards. This eliminates manual data entry, allowing AP staff to focus on more strategic tasks like spend analysis, supplier management, and cash-flow forecasting.
Conclusion
Looking at a single AP metric in isolation doesn’t give you the full story. To truly understand your accounts payable (AP) operation, you need to monitor all nine KPIs together: Days Payable Outstanding, cost per invoice, invoice cycle time, first pass match rate, invoice exception rate, electronic payment adoption, early payment discount capture rate, supplier on-time payment rate, and AP staff productivity. This comprehensive view reveals where your AP process stands today and highlights areas for improvement.
The secret lies in treating these KPIs as an operational control system, not just a reporting tool. Balancing speed and accuracy is crucial – if you focus solely on speeding up processes without watching your exception rate, you risk compromising quality. High-performing teams achieve an invoice exception rate below 10% and invoice cycle times of about 3.3 days because they aim for overall optimization, not isolated improvements.
“You cannot manage what you do not measure.” – TallyScan
Accurate KPI tracking starts with reliable data sources. Instead of manual spreadsheets, build dashboards directly from ERP system event records for a consistent and trustworthy data foundation. Tight ERP integration is essential here. For instance, Oracle ERP systems offer prebuilt AP metrics like Days Payables Outstanding and On-Time Payment Performance, broken down by business unit or supplier for deeper insights. Tools like AP Express enhance this by integrating with Oracle EBS, ERP Cloud, and JD Edwards, automatically pulling relevant data to ensure your KPIs reflect real-time ledger activity.
The difference between top-performing AP teams and average ones is stark. Manual processes can cost $9.40 to $15.00 per invoice and result in error rates around 39%. In contrast, automated teams reduce costs to $2.05–$2.78 per invoice while cutting errors to under 1%. These gains come from setting clear goals, assigning accountability for each metric, and reviewing progress weekly instead of waiting for month-end reports.
If you’re just starting, use the data you have – even if it’s not perfect. Define clear KPI targets, assign ownership, and establish a weekly review routine. Over time, these nine metrics will shift your AP operation from a back-office expense to a strategic advantage – helping manage cash flow, strengthen supplier relationships, and drive smarter financial decisions across your organization.
FAQs
What are good target ranges for each AP KPI for my industry?
Measuring your accounts payable (AP) performance against industry benchmarks can spotlight areas where improvements are needed. Here’s what top-performing teams typically achieve:
- Cost per invoice: Less than $2.07
- Processing time: 3.1–3.3 days (compared to the industry average of 13–15 days)
- Exception rate: Under 10% (industry average is 18–20%)
- Early payment discounts captured: More than 80%
- First-pass match rate: 95% or higher
With AI automation, AP Express helps you hit these targets, streamlining your processes and boosting efficiency.
Which AP KPI should I improve first to lower costs without increasing errors?
To cut costs and minimize errors, aim to improve your straight-through processing (STP) rate. A better STP rate means more invoices get processed automatically, without human involvement. This not only drives down the cost per invoice but also reduces exceptions caused by manual mistakes. You can enhance this key metric by:
- Expanding purchase order (PO) coverage.
- Standardizing e-invoicing practices with your suppliers.
- Leveraging AI tools like AP Express for automated invoice digitization and matching.
Focusing on these strategies can streamline your processes and improve efficiency.
How can I track these KPIs directly in Oracle and with AP Express?
You can monitor Accounts Payable (AP) KPIs in Oracle using prebuilt subject areas like Financials – AP Aging, Financials – AP Invoices, and Financials – AP Payments. These areas offer key metrics such as Days Payables Outstanding, average payment amounts, and aging reports, giving you a clear view of your AP performance.
With AP Express, integration with your ERP allows all processed invoice data to be stored in real time. This ensures seamless visibility through dashboards and simplifies reporting.
Related Articles

How to Calculate ROI on AP Automation Software
May 27, 2026 Calculating ROI for AP automation software boils down to comparing your savings...
Make “Go Paperless” Your Resolution in 2026
January 25, 2022 The most common challenge that comes up in conversations with our prospects...